# Visual Variables
"The term ‘visual variables’ is commonly used to describe the various perceived differences in map symbols that are used to represent geographic phenomena." (Slocum, et al. 2009, p. 81).
Cartographers should pay special attention to match a design between the different symbols as the smallest details can change how the geographical data is interpreted. The individual feature groups demand a different combination of Bertin’s visual variables (see below). J. Bertin proposed these variables in 1983 to differentiate the symbols by values and characteristics they represent. Often other variables such as spacing, focus, and arrangement are mentioned. As for shading and transparency are often used to develop a feeling of a third dimension, as shadows enhance immersion creating a contrast between object and background and inviting the user to click on it. Transparency on the other hand often occurs when objects are “faded out” to cease distraction and let the user focus on other information.
# Characteristics
When considering styling an object with these variables, the purpose should be considered. Depending on that, some variables are more suited than others. Characteristic supporting certein purposes are:
# Selective
A group of symbols is perceived as such based on a change in the variable, i.e. a category can be given to the group.
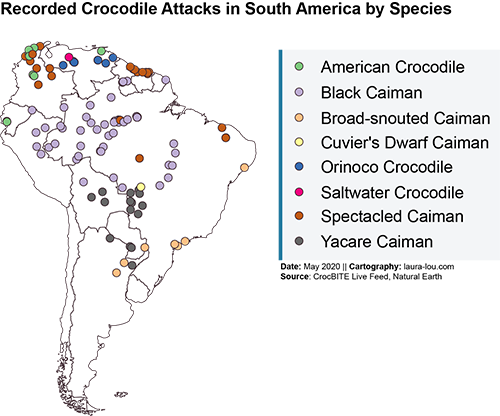
The example above highlights the categories (species names of crocodiles) by color. The corresponding species can be singled our as a group.
# Associative
A variable is associative if the user is able to group symbols despite changes in other variables, e.g. different shaped symbols in a certain color can be either grouped by shape or color.
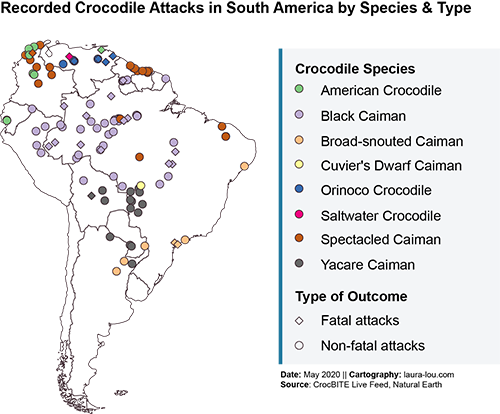
Again using the example of crocodile attacks a second variable is changed (shape). The various species are still grouped by color and can now categorized by the type of outcome as well.
# Order & Quantitative
Order: If objects can be easily recognized as sequence, meaning the symbols can be ordered by their difference, it is an ordered variable.
Quantitative: A visual variable is considered quantitative if a numerical difference can be derived.
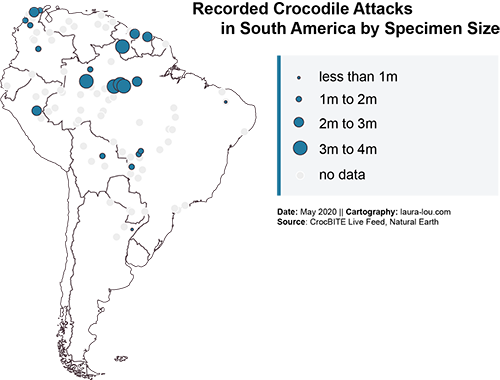
The crocodile attacks are now categorized by specimen size. A ranking can be obtained (from small to large) as well as a numerical value. Therefore this visualization is
# Length
The amount of values is defined by length, i.e. how many distinctions are perceptible.
# Variables
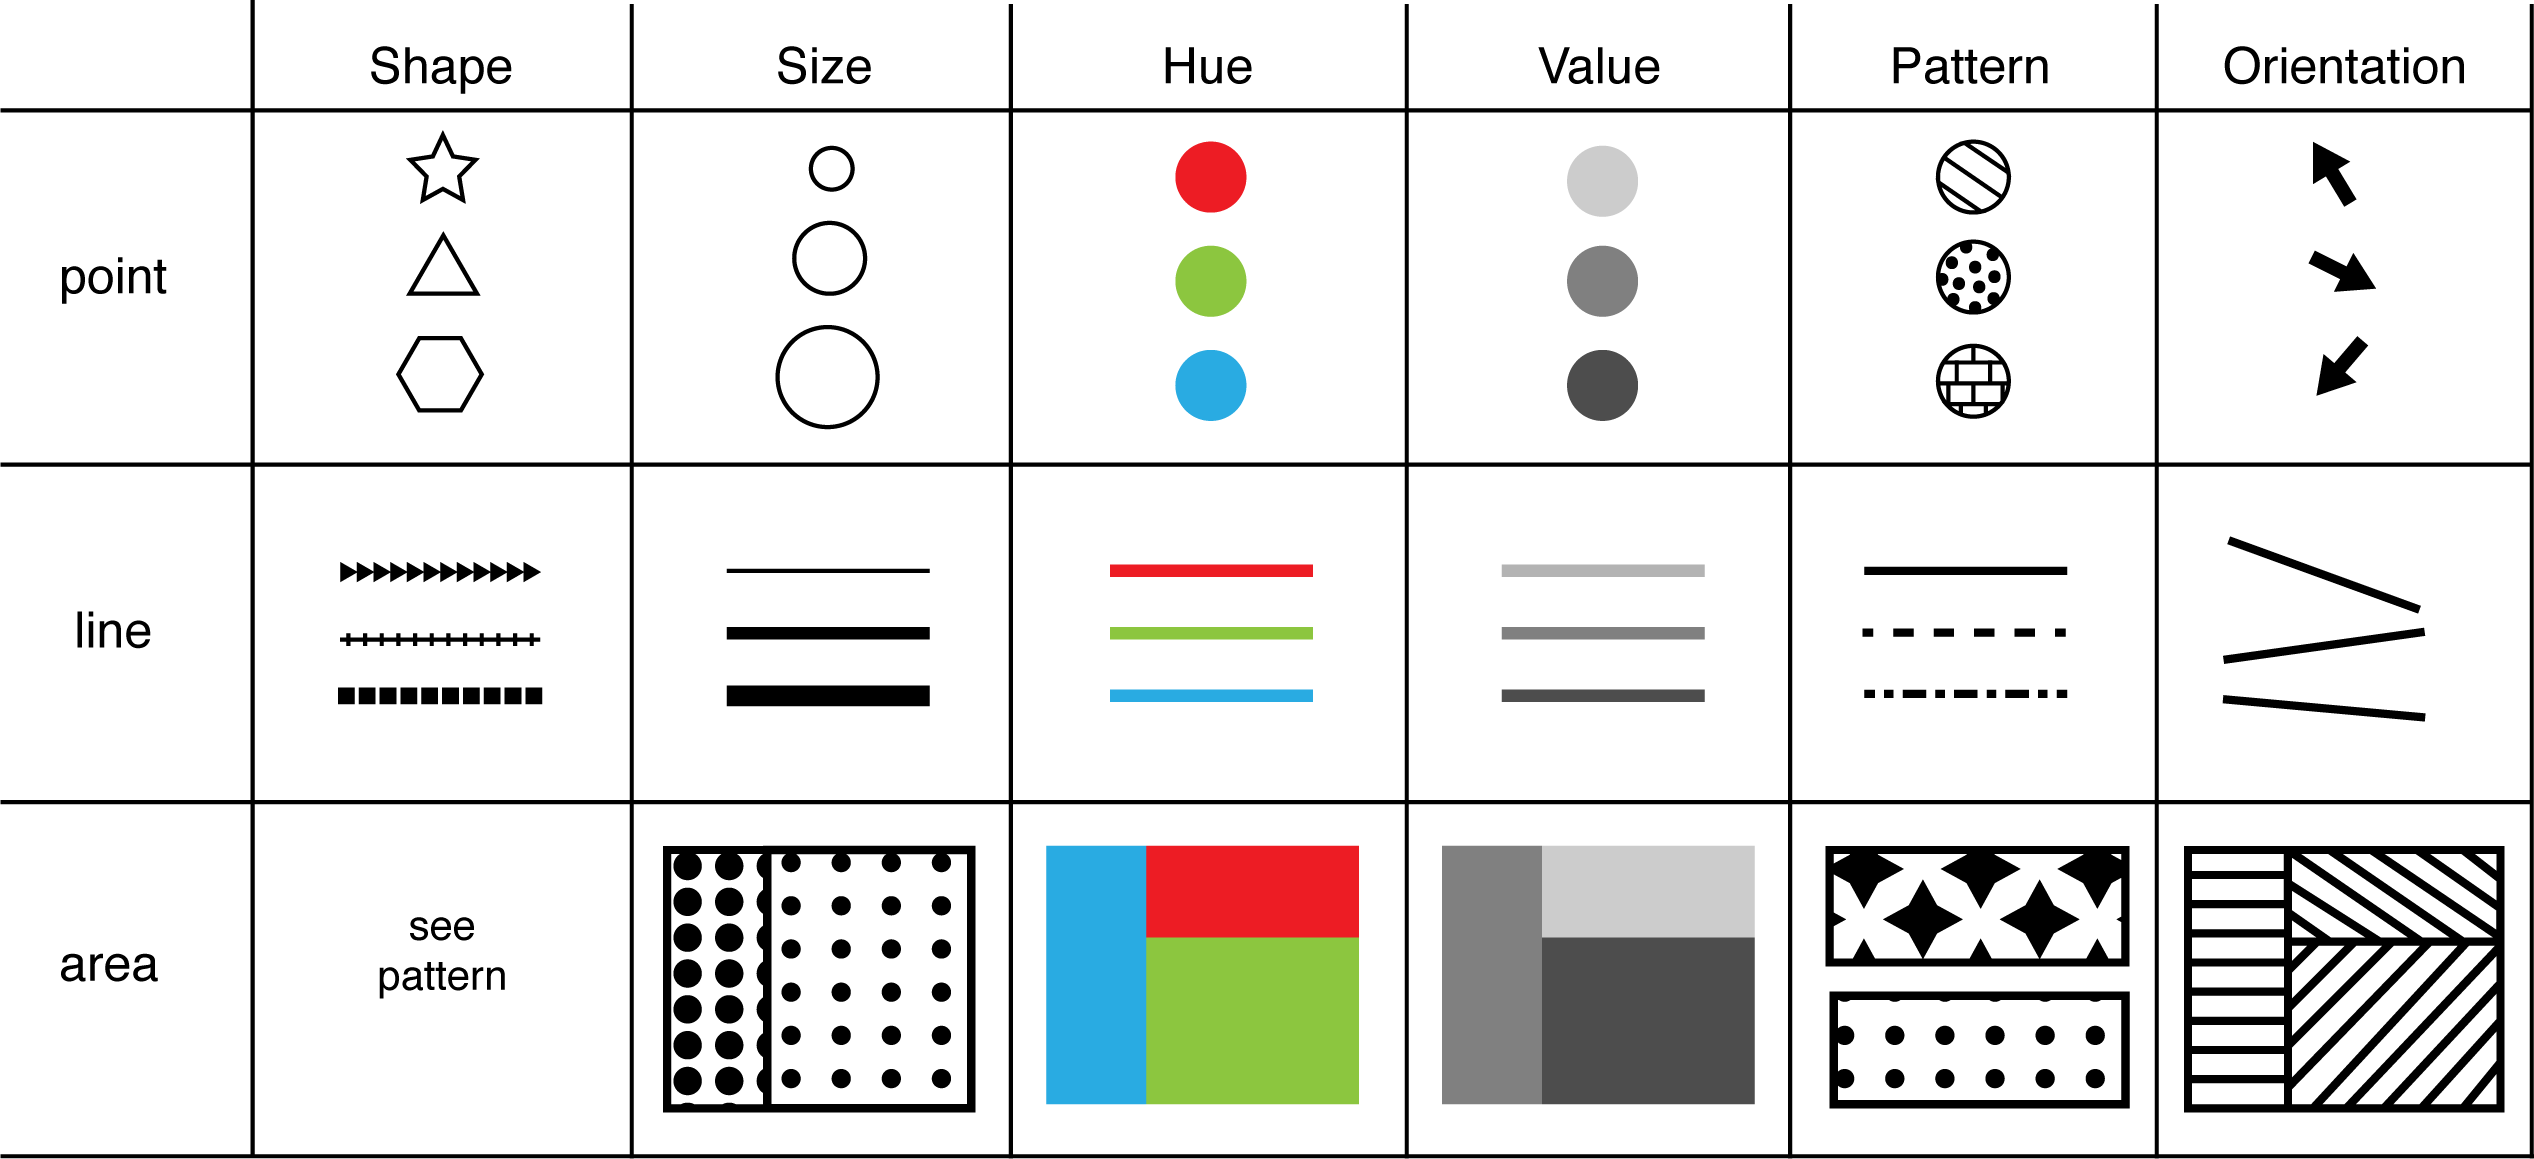
Shape is the change of the external form.
selective, associative, length
Size refers to the difference in dimension of a symbol.
selective, associative, order, (quantitative), length
(Color) Hue describes the color itself, such as green, yellow, red.
selective, associative, length
(Color) Value is the definition of the color brightness, e.g. light green and dark green.
selective, associative, order, (quantitative), length
Pattern / Texture indicates the difference of pattern used to fill a body of object.
selective, associative, length
Orientation describes the alignment of features to one another.
selective, associative, length
(Color) Saturation is the amount of grey in a color and refers to the intensity pf a color. Saturated colors draw more attention an less saturated ones.
order, quantitative, length
Location / Position describes the position of a symbol on the map inseid a coordinate reference, i.e. the position on the map symbol in relation to the projected spatial location.
selective, associative, order, quantitative, length
Arrangement characterizes the layout of map symbols, either applied in an grid-like, regular arrangement or in more irregular way.
(order), (quantitative), length
Crispness / Fuzziness refers to the sharpness of the edge or boundary of a map symbol. Map symbols with a sharp edge draw more attention of the user then map symbols with fuzzy outlines. It can be used to symbolize uncertainty in data.
Resolution / Focus is the spatial precision of a map symbol meaning the degree of generalization. It refers to the details of the linework in vector maps. A high level of detail gains more importance as the focus of the user is shifted towards highly detailed features. In raster maps the coarseness and grid-size define resolution.
order, (quantitative), (length)
Transparency describes the bkending of layers with the objects depicted underneath.
order, quantitative, (length)
# References
- Axis Maps. Visual Variables (opens new window) (accessed 14 Aug 2019).
- Brewer, C. A., 2016. Designing better maps - A guide for GIS users. 2nd Edition ed. Redlands: Esri Press.
- Dent, B. D., Torguson, J. S. & Hodler, T. W., 2009. Cartography - Thematic Map Design. 6th Edition ed. New York: McGraw-Hill.
- Kraak, M.-J. & Ormeling, F., 2003. Cartography - Visualization of Geospatial Data. 2nd Edition ed. Essex: Pearson Education Limited.
- Krygier, J. & Wood, D., 2016. Making Maps - A visual Guide to Map Design for GIS. 3rd Edition ed. s.l.:Guilford Publications.
- Muehlenhaus, I., 2014. Web Cartography. Boca Raton: CRC Press.
- Olaya, Victor (2018). Introduction to GIS (opens new window) (accessed 14 Aug 2019).
- Roth, Robert. (2017). Visual Variables. 10.1002/9781118786352.wbieg0761.
- Slocum, T. A., McMaster, R. B., Kessler, F. C. & Howard, H. H., 2009. Thematic Cartography and Geovisualization. 3rd Edition ed. Upper Saddle River(NJ): Daniel Kaveney.
- Tyner, J. A., 2010. Principles of Map Design. New York: Guilford Press.
- UCGIS. CV-08 - Symbolization and the Visual Variables (opens new window) (accessed 14 Aug 2019).